Businesses today transform raw data into powerful strategies. Data analysis methods bridge the gap between numbers and stories. This guide explores quantitative and qualitative research methodology for effective market research.
Techniques for Quantitative and Qualitative Insights
We’ll uncover secrets behind successful data analysis techniques. These tools help extract meaningful insights from information. Understanding these methods is key for making smart decisions and growing businesses.
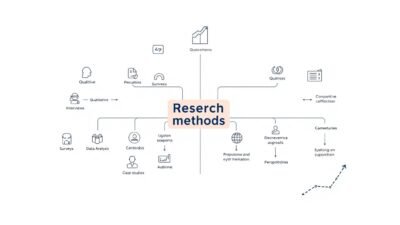
We’ll examine a variety of research tools and approaches. These include surveys, focus groups, statistical software, and thematic analysis. These techniques are valuable for both experienced analysts and curious beginners.
Preparing for the UGC NET exam can be a daunting task, but with the right resources, candidates can navigate the process effectively. Websites like MyJRF provide a comprehensive platform for aspiring educators, offering specialized guidance for UGC NET Paper 2 preparation and essential tips for acing UGC NET Paper 1. Additionally, understanding the revised syllabus provided by UGC is crucial for a targeted study approach. For official announcements and updates, candidates should regularly visit the UGC NET NTA portal, while the UGC’s job section and the main UGC website are invaluable for post-exam opportunities and academic resources. With these tools, candidates can maximize their preparation and set themselves up for success.
Key Takeaways
- Quantitative and qualitative data provide complementary insights
- Effective data analysis drives informed decision-making
- Various tools exist for both quantitative and qualitative analysis
- Integration of different data types offers a holistic view
- Ethical considerations are crucial in data analysis
- Emerging technologies are shaping the future of data analysis
Understanding Quantitative and Qualitative Data
Data analysis methods are vital for research. They help researchers make sense of collected information. Let’s explore two main types of data: quantitative and qualitative.
What is Quantitative Data?
Quantitative data involves numbers and measurable facts. It’s information you can count or put into charts. Sales figures, test scores, and survey ratings are examples.
What is Qualitative Data?
Qualitative data focuses on descriptions and observations. It includes interview responses, field notes, and open-ended survey answers. This data offers detailed insights into people’s thoughts and experiences.
Researchers often use coding techniques to find patterns in qualitative data.
Key Differences Between the Two
The main difference is in what each type measures. Quantitative data shows the “what” and “how many.” Qualitative data explains the “why” and “how.”
| Quantitative Data | Qualitative Data |
|---|---|
| Numerical | Descriptive |
| Objective | Subjective |
| Statistical analysis | Thematic analysis |
| Large sample sizes | Smaller sample sizes |
Both types are crucial in research methodology. Using a mix of these methods gives researchers a fuller understanding. This combination leads to more comprehensive results in studies.
Importance of Data Analysis in Decision Making
Data analysis is crucial for effective decision-making in modern business. It provides valuable insights that drive success. Organizations use analytics tools to interpret data and gain a competitive edge.
Making Informed Decisions
Data-driven decision-making reduces guesswork and minimizes risks. Companies process vast amounts of information to reveal patterns and trends. This approach leads to more accurate predictions and better resource allocation.
Enhancing Customer Understanding
Data analysis helps companies understand customer preferences and behaviors. Businesses can tailor their products by analyzing customer feedback and purchase history. This leads to more effective services and increased customer satisfaction.
Driving Business Growth
Data analysis fuels growth by identifying new opportunities and optimizing operations. Companies use analytics to spot market trends and improve efficiency. This data-centric approach often increases revenue and market share.
| Business Area | Impact of Data Analysis | Key Analytics Tools |
|---|---|---|
| Decision Making | Reduces risks, improves accuracy | Predictive modeling software |
| Customer Insights | Enhances product customization | Customer relationship management (CRM) systems |
| Business Growth | Identifies opportunities, optimizes operations | Market analysis platforms |
Data analysis gives businesses a competitive advantage. It leads to smarter decisions and better customer understanding. As analytics tools evolve, their role in shaping business success will grow.
Techniques for Collecting Quantitative Data
Quantitative data collection is vital in market research. It helps researchers gather numerical data for analysis. Let’s explore three key approaches used in data analysis methods.
Surveys and Questionnaires
Surveys and questionnaires are popular tools for collecting quantitative data. They help researchers reach a large audience quickly. Online surveys offer cost-effective solutions for data gathering.
When designing surveys, clear and unbiased questions are crucial. These questions should yield measurable responses for accurate analysis.
Experiments and Observations
Experiments provide controlled environments for testing hypotheses. Researchers manipulate variables and observe outcomes to draw conclusions. Observational studies involve watching and recording behaviors without intervention.
Both methods offer insights into cause-effect relationships and behavioral patterns. They help researchers understand complex phenomena in controlled settings.
Existing Data Sources
Using existing data sources can save time and resources. This approach analyzes previously collected information from various sources. It’s an efficient way to gain insights without conducting new studies.
Researchers must ensure the data’s relevance and reliability. This step is crucial when using pre-existing information for analysis.
| Data Collection Method | Strengths | Limitations |
|---|---|---|
| Surveys | Large sample size, cost-effective | Potential for response bias |
| Experiments | Control over variables | May lack real-world applicability |
| Existing Data | Time-efficient, broad scope | Possible outdated information |
Each technique offers unique advantages in quantitative data collection. Researchers often combine these methods for comprehensive results. This approach ensures reliable outcomes in market research projects.
Techniques for Collecting Qualitative Data
Qualitative data collection is vital in research methodology. It helps researchers understand human behavior and perspectives deeply. Let’s explore key techniques for gathering qualitative information.
Interviews and Focus Groups
Interviews dive into individual experiences. They can be structured, semi-structured, or unstructured. Focus groups involve group discussions.
These methods generate rich data. They encourage participants to share their thoughts freely.
Open-Ended Surveys
Open-ended surveys allow respondents to express views without limits. They capture nuanced responses, unlike closed-ended questions. These surveys help explore new ideas and gather detailed feedback.
Ethnographic Studies
Ethnographic research observes people in their natural environment. Researchers immerse themselves in participants’ worlds. This technique provides contextual data that other methods might miss.
“Qualitative research is about capturing life as it is lived. The richness of human experience can’t always be quantified.”
These qualitative techniques offer deep insights into human behavior. They form a crucial part of modern market research. Researchers use them to gain valuable information for decision-making.
Tools for Quantitative Data Analysis
Powerful analytics tools are essential for quantitative data analysis. They process large datasets and reveal valuable insights. Let’s explore key types of tools used in statistical analysis.
Statistical Software Options
Advanced statistical software packages are vital for quantitative analysis. They offer robust capabilities for complex calculations and model building. Popular options include SPSS, SAS, and R.
Each software provides unique features for different analytical needs. These tools form the backbone of in-depth statistical analysis.
Spreadsheet Applications
Spreadsheet programs like Microsoft Excel and Google Sheets are versatile tools. They excel in data entry, simple calculations, and creating basic charts.
These applications serve as accessible starting points for many analysts. They’re great for data organization and basic analysis.
Data Visualization Tools
Visualization tools turn raw data into compelling visual stories. Platforms like Tableau and Power BI create interactive dashboards and charts.
These tools enhance data interpretation and presentation. They help analysts convey complex information in an easy-to-understand format.
| Tool Type | Examples | Key Features |
|---|---|---|
| Statistical Software | SPSS, SAS, R | Advanced statistical tests, model building |
| Spreadsheets | Excel, Google Sheets | Data organization, basic analysis, simple charts |
| Visualization Tools | Tableau, Power BI | Interactive dashboards, complex visualizations |
Choosing the right mix of analytics tools is key for effective data analysis. Each tool offers unique strengths for different tasks.
Integrating these tools can lead to more comprehensive insights. It also enables robust statistical analysis approaches.
Tools for Qualitative Data Analysis
Qualitative data analysis methods reveal deep insights from non-numerical data. They are vital in research methodology. This section explores key tools and techniques for qualitative analysis.
Thematic Analysis Techniques
Thematic analysis identifies patterns within data. Researchers use color coding or mind mapping to organize ideas. This method allows flexible interpretation of complex information.
Software for Coding Data
Coding software streamlines qualitative analysis. These tools help categorize and interpret large amounts of text data. Some popular options include:
- NVivo
- ATLAS.ti
- MAXQDA
These programs offer automatic coding, visualization tools, and collaboration options. They’re crucial for managing complex qualitative datasets efficiently.
Content Analysis Approaches
Content analysis examines text data systematically. It can be both quantitative and qualitative. Researchers use it to identify trends, patterns, and themes in various content.
Common steps include:
- Defining the research question
- Selecting the content to analyze
- Developing coding categories
- Coding the content
- Analyzing and interpreting results
This method works well for analyzing interviews, social media posts, or policy documents. It provides a structured way to extract meaning from diverse text sources.
| Analysis Technique | Key Feature | Best Used For |
|---|---|---|
| Thematic Analysis | Pattern identification | Exploratory research |
| Coding Software | Data organization | Large datasets |
| Content Analysis | Systematic examination | Text-based data |
Data Interpretation Strategies for Quantitative Insights
Quantitative data interpretation requires specific statistical analysis approaches. These strategies help extract meaningful insights from numerical information. Let’s explore key techniques used in quantitative analysis.
Descriptive Statistics
Descriptive statistics provide a snapshot of key features in your data. They include mean, median, mode, and standard deviation. These tools help identify patterns in large data sets.
Inferential Statistics
Inferential statistics draw conclusions about populations based on sample data. This approach uses probability theory to make predictions. Hypothesis testing and confidence intervals are key inferential techniques.
Regression Analysis
Regression analysis examines relationships between variables. It predicts how changes in one variable affect another. Linear regression is common, but other forms exist for different data types.
This technique is valuable for forecasting and understanding cause-effect relationships.
| Technique | Purpose | Example Use |
|---|---|---|
| Descriptive Statistics | Summarize data | Average test scores |
| Inferential Statistics | Draw conclusions | Election poll results |
| Regression Analysis | Predict relationships | Sales forecast models |
These statistical approaches form the foundation of quantitative data interpretation. By mastering these strategies, researchers can unlock valuable insights within their data sets.
Data Interpretation Strategies for Qualitative Insights
Qualitative data analysis methods reveal deep insights into human experiences. This section explores key approaches for interpreting non-numerical information. These techniques help researchers uncover meaningful patterns in complex data.
Narrative Analysis
Narrative analysis examines stories and personal accounts. Researchers study plot structures, character development, and themes. This technique is valuable in psychology and anthropology.
Framework Analysis
Framework analysis organizes qualitative data into thematic categories. Researchers create a matrix to sort information and identify patterns. This structured approach helps manage large datasets efficiently.
Grounded Theory Approach
The grounded theory approach develops theories from raw data. Researchers analyze information without preconceived notions, allowing new concepts to emerge. This method excels at uncovering hidden insights in various fields.
| Strategy | Key Focus | Best Used For |
|---|---|---|
| Narrative Analysis | Stories and experiences | Understanding personal perspectives |
| Framework Analysis | Organizing themes | Managing large datasets |
| Grounded Theory | Theory development | Discovering new concepts |
Mastering these methods helps researchers extract valuable insights from non-numerical information. Each strategy offers unique strengths in uncovering human experiences. Researchers can choose the best approach for their specific project needs.
Effective Integration of Quantitative and Qualitative Data
Merging quantitative and qualitative data offers a full picture in market research. This combo boosts data interpretation strategies. It also provides richer insights for businesses.
Merging Insights for a Holistic View
Mixing numbers with descriptions gives a complete market snapshot. Sales figures paired with customer feedback reveal deeper market trends. This blend helps businesses make smarter decisions.
Case Studies of Integrated Approaches
A tech firm used surveys and interviews to enhance their product design. This mixed approach boosted user satisfaction by 30%. The company gained valuable insights from both data types.
| Method | Data Type | Insight Gained |
|---|---|---|
| Online Survey | Quantitative | 85% preferred mobile app |
| User Interviews | Qualitative | Desire for personalized features |
| Usage Analytics | Quantitative | 50% increase in daily active users |
Best Practices for Integration
Good integration needs careful planning. Begin with clear research goals. Use numbers to spot trends.
Then, dig into reasons behind trends with qualitative methods. This approach makes market research techniques stronger.
Successful integration needs matching methods. Numbers show the what, while descriptions explain the why. Together, they create a strong toolkit for deep market analysis.
Overcoming Challenges in Data Analysis
Data analysis methods face various hurdles. Researchers must recognize these challenges to navigate data interpretation complexities. This knowledge helps maintain accurate and reliable research findings.
Common Pitfalls to Avoid
Researchers often encounter pitfalls in data analysis. These include sampling bias, misinterpreting correlation as causation, and overlooking outliers. Awareness of these issues helps maintain research integrity.
- Sampling bias: Ensure representative data collection
- Correlation vs. causation: Avoid drawing hasty conclusions
- Outlier analysis: Investigate unusual data points thoroughly
Ethical Considerations
Ethics play a vital role in data analysis. Researchers must protect participant privacy and handle sensitive information responsibly. Obtaining informed consent and being transparent about methods are crucial.
Ensuring Data Quality
High-quality data forms the basis of reliable analysis. Researchers should use rigorous cleaning procedures and validate data sources. Appropriate statistical techniques and regular quality checks help maintain data integrity.
| Data Quality Factor | Importance | Action Steps |
|---|---|---|
| Accuracy | Critical | Double-check data entry, use automated validation tools |
| Completeness | High | Address missing values, conduct follow-up surveys if needed |
| Consistency | Moderate | Standardize data formats, resolve conflicting information |
Addressing these challenges enhances the reliability of data analysis efforts. Robust research methodology ensures accurate and actionable insights. This approach leads to more impactful and trustworthy research outcomes.
Future Trends in Data Analysis
Data analysis is rapidly changing how we understand information. New tools and methods are reshaping the field. Let’s explore key trends revolutionizing data analysis.
The Rise of AI and Machine Learning
AI and machine learning are now vital in data analysis. They process huge amounts of data quickly, finding patterns humans might miss. AI-powered tools make predictions more accurate and insights more useful.
Growing Importance of Big Data
Big data is crucial in modern analytics. Companies use massive datasets to gain deeper insights. This trend drives new analysis methods designed for big data.
Emerging Analytical Techniques
New techniques are changing data analysis. Predictive analytics uses past data to forecast future trends. Sentiment analysis helps businesses understand customer opinions from text data.
These methods are becoming essential for data analysts.
| Trend | Impact on Data Analysis |
|---|---|
| AI and Machine Learning | Faster processing, better pattern recognition |
| Big Data | Deeper insights, more comprehensive analysis |
| New Analytical Techniques | Improved forecasting, better understanding of qualitative data |
These trends are shaping the future of data analysis. Analysts must learn new skills to keep up. The field offers exciting possibilities for those ready to adapt.
Resources for Mastering Data Analysis Techniques
Data analysis methods can be challenging to learn. But don’t worry! Many resources can help you improve your skills. Let’s explore some great learning options for analysts at all levels.
Recommended Books and Journals
“The Art of Data Science” by Peng and Matsui offers a solid foundation. For research methodology, try “Research Design” by John W. Creswell.
Stay updated with journals like “Data Science Journal” and “Big Data & Society”. These publications provide fresh insights into data analysis techniques.
Online Courses and Webinars
Coursera and edX offer data analysis courses from top universities. Try Harvard’s “Data Science: R Basics” or Michigan’s “Applied Data Science with Python”.
For live learning, join American Statistical Association webinars. These sessions cover modern research methods and tools.
Professional Organizations and Communities
Join groups like the Data Science Association or International Association for Statistical Computing. These communities offer forums, conferences, and networking events.
Here, you can discuss data analysis methods and share experiences. Remember, constant learning is crucial in this fast-changing field.
FAQ
What are the main differences between quantitative and qualitative data?
Quantitative data is numerical and measurable. It focuses on numbers and statistics. Qualitative data is descriptive, providing rich information about behaviors and experiences.
How does data analysis contribute to decision-making processes?
Data analysis provides evidence-based insights for informed decisions. It uncovers patterns and trends in data. This helps organizations understand customers better and drive business growth.
What are some common techniques for collecting quantitative data?
Surveys and questionnaires are popular for gathering quantitative data. Experiments and observations also yield numerical information. Existing data sources can be used for statistical analysis.
How can qualitative data be effectively collected?
Interviews and focus groups are effective for collecting qualitative data. Open-ended surveys provide in-depth insights. Ethnographic studies reveal complex human behaviors and opinions.
What tools are commonly used for quantitative data analysis?
Statistical software like SPSS or R process large datasets. Spreadsheets like Microsoft Excel perform complex calculations. Data visualization tools such as Tableau help present findings.
How is qualitative data typically analyzed?
Thematic analysis and content analysis are common for qualitative data. Coding helps identify patterns and themes. Software like NVivo assists in organizing and analyzing non-numerical information.
What are some key strategies for interpreting quantitative data?
Descriptive statistics summarize quantitative data effectively. Inferential statistics help draw conclusions from datasets. Regression analysis reveals relationships between different variables.
How can qualitative insights be effectively interpreted?
Narrative analysis uncovers deep insights from qualitative data. Framework analysis organizes complex information. The grounded theory approach helps develop new concepts from data.
Why is integrating quantitative and qualitative data important?
Combining quantitative and qualitative data provides a comprehensive understanding. It leverages strengths of both data types. This approach leads to more robust insights and strategies.
What are some common challenges in data analysis?
Avoiding biases is a key challenge in data analysis. Ensuring data quality is crucial for reliable results. Ethical considerations and managing complex datasets are also important issues.
How is AI and machine learning impacting data analysis?
AI and machine learning revolutionize data analysis techniques. They enable sophisticated processing of large datasets. These technologies automate complex tasks and uncover hidden patterns.
Where can I find resources to improve my data analysis skills?
Academic journals offer in-depth knowledge on data analysis. Online courses provide practical skills training. Professional organizations offer networking and learning opportunities for data enthusiasts.